Understanding Sound Power, Sound Pressure, and Acoustic Testing
Acoustic performance is often treated as secondary in linear motion systems, yet in high-precision or low acoustic applications, it can be critical. This paper explains how quiet linear actuators should be properly characterized, clarifying the difference between sound pressure (Lp), sound power (LW), and the importance of ISO 3744 standardized testing in controlled acoustic environments. Independent ISO-based measurements demonstrate ultra-low A-weighted sound pressure and sound power levels under defining operating conditions, and spectral analysis highlights how actuator architecture influences tonal behaviour and overall acoustic output.
Why Quiet Linear Actuators Performance Matters
In most linear actuator applications, acoustic performance is not the primary design driver. Force, stroke, speed, power, and environmental constraints typically take priority, with noise addressed later, often after a prototype reveals it as a problem.
That approach works in many industrial settings. It becomes an issue when the system itself must be quiet. In acoustic testing applications, even a small servo motor can noticeably raise the measurement floor. If the actuator used to test another product contributes measurable airborne or structure-borne energy, it can contaminate the data you are relying on to validate other design choices. In metrology and instrumentation, vibration can couple into sensitive equipment. In medical, research, recording, and certain defense systems, unintended acoustic energy can compromise performance or overall system viability.
Where Actuator Noise Comes From
Linear actuators are neither inherently loud nor inherently silent. Screw-driven systems introduce mechanical contact and recirculating elements under load. Geartrains create meshing frequencies, servo systems can induce electrical hum, pneumatics add airflow and exhaust noise. Structures transmit and amplify vibration, and switching electronics contribute high-frequency content. These sources interact differently depending on load, motion profile, mounting stiffness, and control strategy. When multiple frequencies couple within a complex mechanical structure, their combined output is not a simple addition.
Other factors that affect acoustic output include; speed, acceleration, structural coupling, and control strategy. Acceleration ramps, jerk limits, and switching frequency can significantly shift an acoustic profile without changing hardware, provided the system allows these parameters to be adjusted in software. An actuator that appears nearly silent during slow, unloaded motion on an electronics bench, seen in Figure 1 resting unsecured on a squishy antistatic mat, may sound very different once bolted into a system and driven dynamically. Tonal peaks, enclosure amplification, and structure-borne transmission often dominate what users actually perceive.
 Figure 1. ORCA motor resting unsecured on a squishy antistatic mat.
The critical question is not whether an actuator is described as “quiet,” but whether its acoustic behaviour has been characterized under meaningful operating conditions and measured in a way that allows valid comparison.
Why Most dB Ratings Are Not Comparable
Noise is often reduced to a single number, such as 20 dB. While this appears precise, a standalone decibel value is not meaningful for engineering comparison.
Sound Power vs Sound Pressure
The sound power level (SWL, or LW) indicates the total acoustic energy that a piece of equipment radiates to its environment. The sound pressure level (SPL, or Lp) is a measure of the effect of the energy of an acoustic source. Sound pressure depends on the distance to the source and the acoustic properties of the environment.
For a given operating condition, the sound power level of a piece of equipment is a fixed value. The sound pressure level will always depend on the position of the measurement and the operating environment.
Sound Units: dB and dBA Are Not the Same
The decibel (dB) is the unit for both sound pressure and sound power level, relative to a reference pressure. It is common to apply an A-weighting curve that reduces very low and very high frequencies to better reflect how the human ear perceives sound. Because of this weighting, the same acoustic signal can produce different values depending on how its energy is distributed across the range of audible frequencies.
|
Parameter |
Abbreviation |
Symbol |
Symbol (A Weighted) |
Units |
|
Sound Pressure |
SPL |
Lp |
LpA |
dB |
|
Sound Power |
SWL |
LW |
LWA |
dB |
dBA is sometimes used as shorthand to represent an A-weighted reading. This is not supported by ISO standards, which require that the A be contained in LpA or LWA and accompanied by a proper clarifying description.
The Limits of Sound Pressure Level
Many manufacturers advertising “quiet” actuators publish little or no acoustic data. When data is provided, it is typically a single sound pressure level value, often measured under unspecified conditions. What was the distance from the microphone to the object under test? What was the device doing during the measurement? Was the microphone properly calibrated? How were frequencies weighted? What environmental or room effects were present?
Sound pressure level is position-dependent. It represents what a microphone detects at one location, in one environment. Change the microphone distance, the room, or nearby reflective surfaces, and the value changes. SPL is useful when evaluating what a user hears at a defined position, but it does not fully describe the acoustic output of the device itself.
Why Sound Power Level Matters
Sound power level represents total radiated acoustic energy emitted by a source. It is calculated from multiple sound pressure measurements taken over a defined measurement surface using standardized methodology. When performed in a qualified anechoic or hemi-anechoic chamber, the result characterizes the source under defined operating conditions rather than the surrounding environment.
When only sound pressure level is published, meaningful cross-product comparison of actuator noise ratings becomes difficult. Without defined test conditions, background noise margins, and measurement geometry, a low decibel claim may reflect the measurement setup more than actual device performance.
For engineers evaluating a quiet linear actuator or other low-noise device, the absence of published sound power level data should raise questions. Sound power measured under defined ISO conditions provides a defensible and comparable basis for evaluation.
How Quiet Linear Actuators Should be Tested
Measuring a very quiet actuator properly requires controlled methodology.
Standardized Sound Power Measurement
ISO 3744 defines an engineering method for determining sound power from measured sound pressure. Rather than relying on a single microphone, the device is evaluated over a defined measurement surface using multiple microphone positions. The standard specifies measurement geometry, averaging time, and environmental corrections to ensure repeatability.
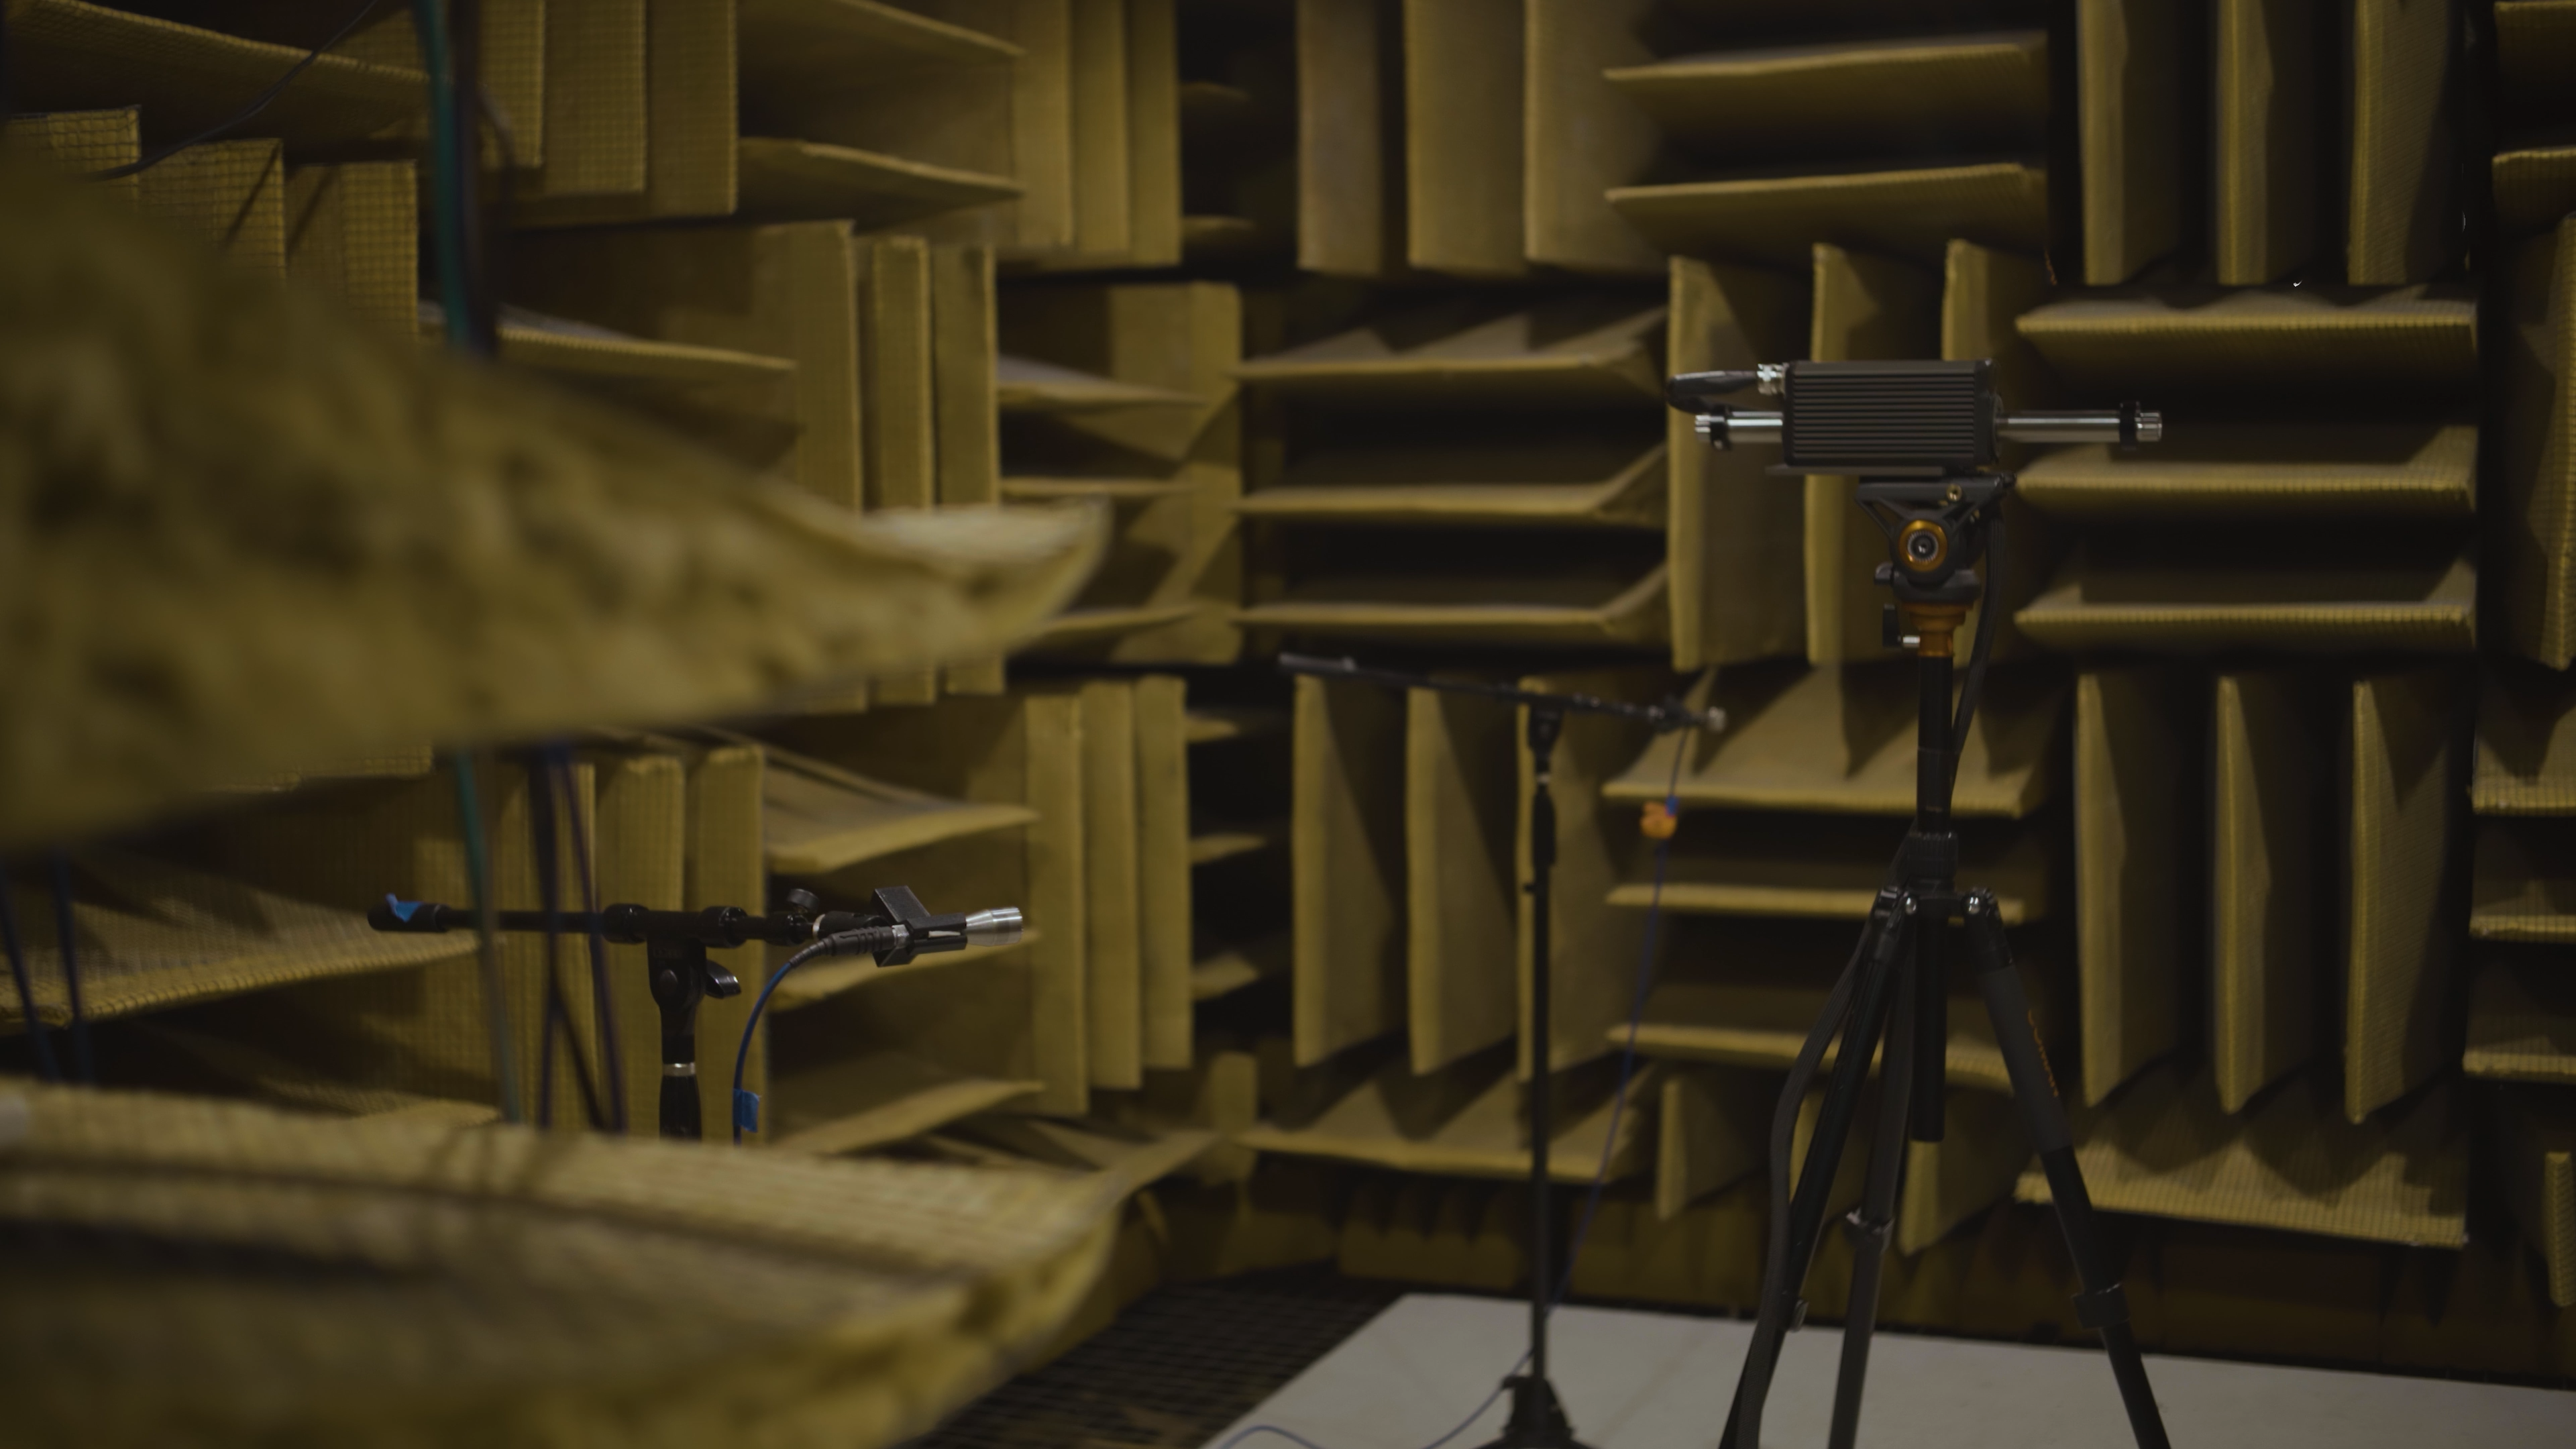
Figure 2. ORCA motor being tested with a five-microphone parallelepiped geometry within Orfield's Anechoic Chamber.
To address inconsistencies in acoustic measurement, the International Organization for Standardization (ISO) developed standardized test methods to establish repeatable and controlled procedures for determining sound power from measured sound pressure, resulting in ISO 3744.
High-accuracy measurements are performed in anechoic or hemi-anechoic chambers qualified under ISO 3745, where reflections are minimized and acoustic behaviour remains predictable across defined frequency ranges.
Background Noise and Measurement Limits
Background noise must remain at least 10 dB below the measured device output across relevant frequency bands. For ultra-quiet devices, chamber capability can become the limiting factor as the device approaches the measurement floor.
Defining the Operating Conditions
Operating conditions must be clearly defined. Holding position does not represent dynamic motion. Orientation, load, and mounting configuration all influence acoustic output. Without controlled conditions and defined parameters, a decibel value may reflect the test environment more than the actuator itself.
Independent Acoustic Testing at Orfield Laboratories
An ORCA-6-24V smart linear motor was independently tested at Orfield Laboratories in Minneapolis, Minnesota, in August 2025, following ISO 3744 test protocols. Orfield Laboratories is a multi-sensory design and acoustic test research facility, internationally recognized for its precision acoustic measurement capabilities. Its acoustics lab is accredited by NVLAP (Lab Code 200248). It's world-famous anechoic chamber that has been recorded by Guinness World Records as one of the quietest rooms on Earth.
Test Configuration
| ORCA-6-24 set to a 6-inch stroke |
| Vertical orientation |
| Unloaded |
| 1 meter measurement surface |
| Five-microphone parallelepiped geometry |
Summary of Measured Results
|
Operating Condition |
Sound Pressure Level LpA dB |
Sound Power Level LWA dB |
|
Holding Position |
12.8 |
24.3 |
|
0.5Hz (2 sec) Sine |
16.6 |
28.0 |
|
1.0 Hz (1 sec) Sine |
20.4 |
33.5 |
|
2Hz (0.5 sec) Sine |
27.0 |
39.7 |
Under the controlled 0.5Hz (2 second) sinusoidal profile, measured sound pressure averaged 16.6 dBA, with corresponding sound power of 28.0 dB. Many quiet indoor environments measure in the 20–30 dB range, as shown in Figure 3, meaning this level falls below typical ambient background in most rooms.
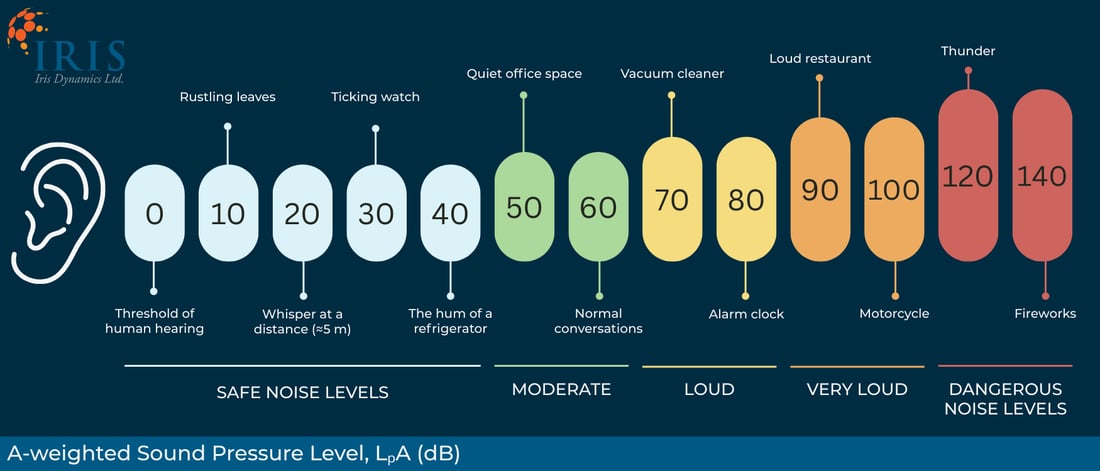
Figure 3. A-weighted Sound Pressure Level, LₚA (dB)
In the holding position, measured A-weighted levels were within approximately 0.5 dB of the chamber background. Across much of the frequency spectrum, the actuator output was only marginally above ambient. In practical terms, the device was operating very near the measurement floor of the chamber. Within this size, stroke, and power class, independently measured sound power values at this level are uncommon, particularly among electric linear actuators.
Linear Motor Architecture and Mechanical Noise Sources
Actuator architecture has a direct impact on how noise is generated and how stable that noise remains over time.
Many screw-driven systems rely on ball screws, recirculating rolling elements, and gear reduction. These mechanisms introduce periodic mechanical excitation, producing narrowband tonal components at predictable frequencies. In quiet environments, those tonal peaks can dominate perception, even when overall dBA levels appear low.
The ORCA smart linear motor architecture, shown in Figure 4, uses a direct-drive linear motor with a single moving element and no recirculating mechanical components. Eliminating ball screws, gear trains, and mechanical simplicity reduces periodic contact events and the opportunity for tonal buildup. The motor is fully integrated and potted, securing internal components to reduce vibration, resonance, and long-term acoustic variability, while also enabling IP68 sealing.

Figure 4. Cross section of an ORCA motor with visible internal components and epoxy filling the surrounding volume.
During ISO testing, the measured spectrum was broadband and low in amplitude rather than dominated by narrow peaks. Reduced periodic excitation corresponded with reduced tonal dominance and lower measured sound power under controlled conditions.
Operating Conditions and Acoustic Envelope
A laboratory measurement establishes a repeatable baseline, NOT a fixed acoustic identity.
In testing, motion profiles were tightly controlled. A 0.5 Hz sinusoidal profile, (2 second) sinusoidal cycle produces different excitation than a 2Hz (0.5 second) faster cycle. As motion frequency increased, measured sound power increased accordingly, reflecting higher velocity and higher acceleration introducing more dynamic energy into the system.
Holding position represents yet another condition. When stationary, the actuator operates near the practical measurement floor of the chamber. Under dynamic motion, acoustic output rises in proportion to demand.
Mounting also influences results. Orientation, structural coupling, and enclosure effects can alter what is radiated. A single test condition does not represent the full acoustic envelope of an application.
A published decibel value therefore represents a defined operating scenario, not a constant property of the device. For applications requiring silent or near-silent actuation, the complete acoustic envelope should be considered and test conditions should be disclosed clearly.
Independent ISO-based sound power testing reduces ambiguity by defining the operating case and enabling meaningful comparison beyond single-point SPL claims.
Frequency Content and Perceived Noise
A single A-weighted value summarizes total acoustic energy. It does not describe how that energy is distributed across frequency.
Human hearing is most sensitive between roughly 1 kHz and 5 kHz, which the A-weighting curve emphasizes while reducing very low and very high frequencies. Two devices can therefore share the same A-weighted level yet exhibit very different spectral behaviour.
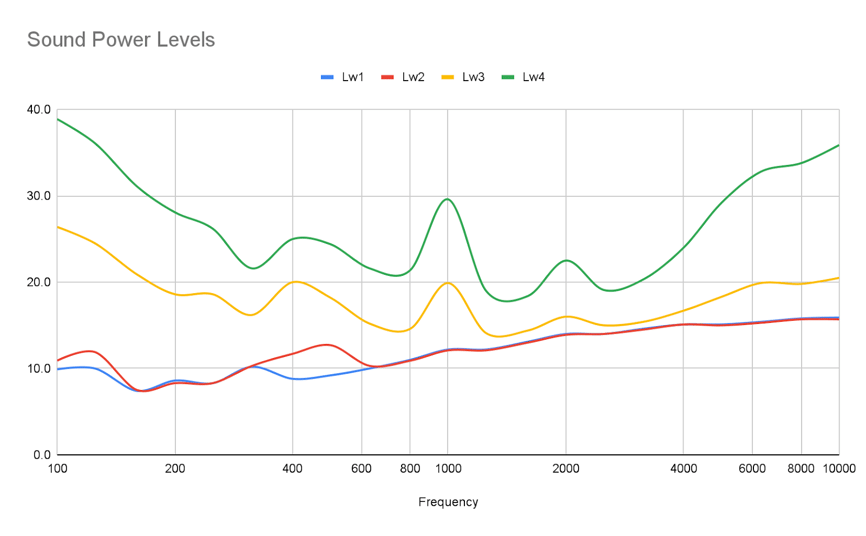
Figure 5. Typical sound power level plot showing levels at different operation points
When reviewing frequency plots, engineers should focus on tonal peaks, broadband distribution, and narrowband components that rise above baseline.
Under the 0.5 Hz motion profile (2 seconds), the measured spectrum was broadband and low in amplitude, without dominant tonal peaks. As motion frequency and acceleration increased, higher-frequency energy increased, contributing to higher overall sound power.
Some systems exhibit narrow spikes at electrical switching frequencies, often above 20 kHz. These may be visible in instrumentation but contribute minimally to perceived loudness under A-weighting. Spectral data must be interpreted in context.
For low acoustic signature applications, low-amplitude broadband output is generally preferable to tonal behavior. Frequency analysis reveals not only how loud a device is, but how that loudness is structured.
Selecting a Quiet or Low Acoustic Signature Linear Actuator
In acoustic test chambers and precision laboratory systems, independently measured sound power under ISO-controlled conditions provides a defensible baseline. The motion system must not raise the measurement floor. Total radiated energy matters.
In other applications, the requirement is simpler but no less important. Whether the goal is a near-silent actuator for submerged low acoustic signature systems, motion inside recording studios, animatronics in location-based entertainment, medical devices, or high-end consumer installations, the objective is the same. Minimize acoustic disturbance under real operating conditions.
The key questions are practical. How was the noise measured? Under what motion profile? Does the architecture inherently generate tonal mechanical excitation? What happens when acceleration or load increases? What does the frequency content look like? Many actuators marketed as “quiet” publish little data beyond single-point sound pressure levels, which do not describe total radiated energy or spectral behaviour.
Ultimately, a quiet linear actuator comes down to two things: architecture and verification. Architecture influences what acoustic energy is generated in the first place. Verification determines whether the published numbers are meaningful and comparable. If acoustic performance is critical to your system, treat it as a design parameter early. Review measured data, evaluate spectral content under your expected motion profile, and engage with engineering before the design is locked. Quiet performance is achievable, but it requires both the right hardware and measurement discipline.
-1.png?width=1100&height=163&name=CTA%20Banners%20for%20Blogs%20(3)-1.png)